Beefsteak Cultivar Trials- Part 2 (The Numbers)
Overview

•This evaluation was carried out both to increase our knowledge
of several available beefsteaks and to provide information for
growers who may be considering these tomato cultivars.
Cultivars were obtained from a variety of seed suppliers to
represent a broad selection.
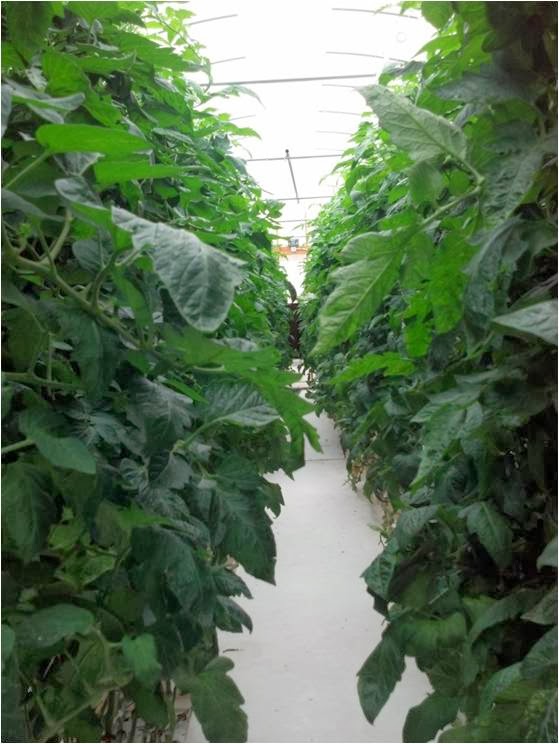
•Ten cultivars were trialed in small 4-plant blocks with two replications.
•The whole evaluation was completed in one row of a 22’ x 64’ x 10’ greenhouse
•Seeded 12/18 (All seedlings)
•Transplanted 1/14 (~ 4 ft2 per plant)
•First harvest 4/8
•Growing point removal 11/11
•Last harvest occurred on 12/16
•Data analyzed with Proc GLM and means difference letters calculated by LSD (different letters represent
statistically different cultivar averages)
Data Considerations
In this post, I would like to give a perspective on comparative yield and fruit size throughout the season for
one of the trials in our greenhouse. However, before presenting this data, some important facts need to be
noted.
• Always keep in mind that this is small plot research. Due to size constraints in our trial greenhouse and the
time involved in data collection, these trials cannot be carried out on a full production scale.
• It is critical to keep in mind that production numbers reported here are not necessarily repeatable in your
greenhouse due to the influence of light, humidity and other environmental factors.
• This whole trial was completed in an outside row of the greenhouse so light conditions were more optimum
and interior rows may not produce comparable yields.
• The percentage of difference between cultivars in full row trials do not always directly follow small plot
trials.
• This work was carried out in OH, so our environmental conditions will not necessarily match other
locations.

Environmental Overview

*40% white shade cloth was installed July 16th and removed August 20th, so these solar radiation averages
reflect the loss of light in the greenhouse due to shading. Additionally, in the warmest and most humid
portions of the summer, some condensation on the plastic also reduced incoming radiation.
Cluster Counts/Fruit Set
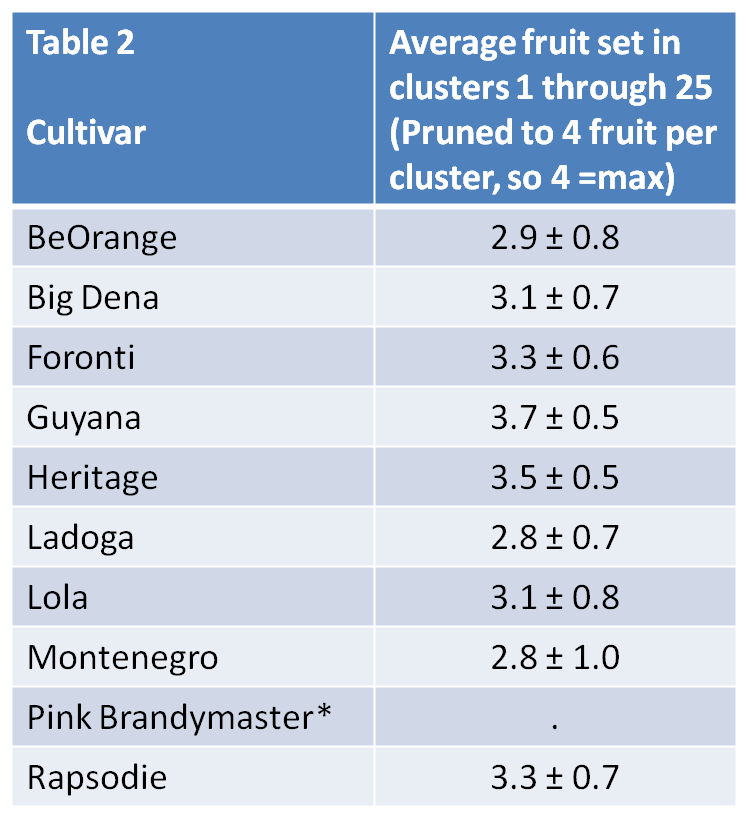
These numbers were derived from periodic counts of harvestable fruit from each cluster. The numbers were not statistically analyzed in the same way as the yield data that follows, but standard deviations (sd) are reported. These sd illustrate that there was variability in fruit set across clusters due to nutrition and environmental conditions. Additionally, they suggest that some cultivars were more sensitive in terms of loss of flowers or fruit. One other note about these cluster counts is that in May we installed a reverse osmosis system in response to higher than optimum sodium levels in our source water which impacted fruit set on some clusters. Counts were not taken on Pink Brandymaster due to the uneveness of clusters as a result of cultivar tendencies.
Fruit Number
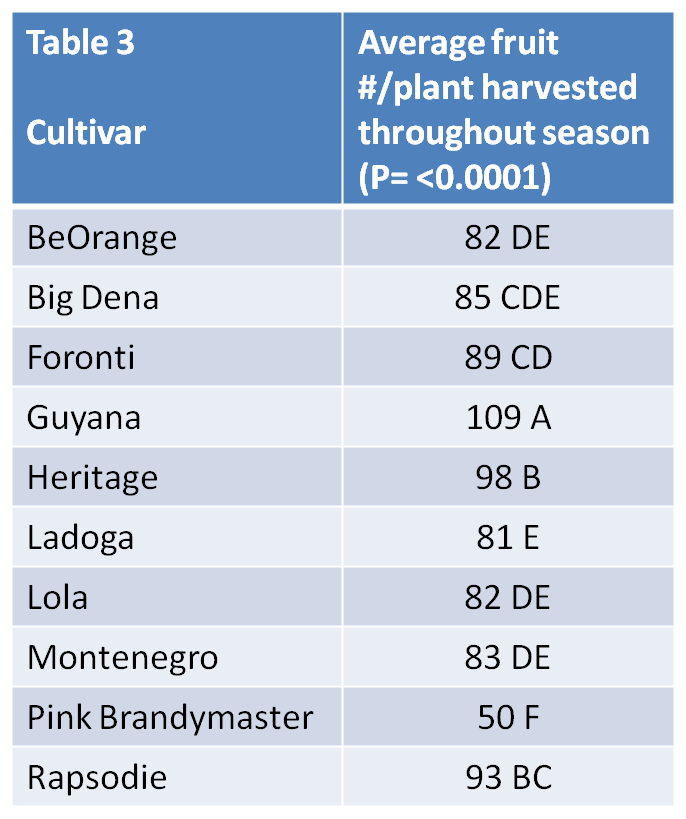
These numbers were derived from fruit counts taken at
harvest. So, these data correspond closely to the data
presented inthe previous table. Keep in mind that the
cluster count averages represent clusters 1 through 25,
but fruit was harvested from 28 to 32 clusters per plants
in many cultivars. Not surprisingly, the cultivars
that maintained the highest average fruit per cluster
finished with the highest numbers of fruit.

Fruit Size
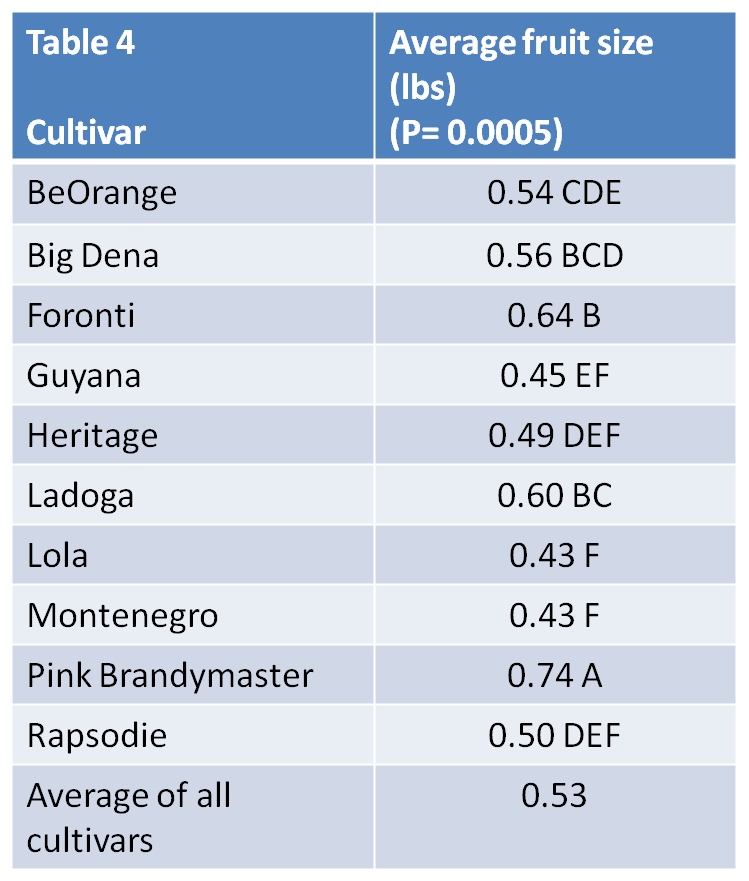
It is important to keep in mind that these fruit sizes are averaged across the whole harvest season. To give a perspective on fruit sizes across the season, the previous blog post gave fruit weight averages from an early and a late season harvest for each cultivar. With all cultivars combined, the average of all April harvests was 0.61 lbs per fruit. Across all June harvests, the average fruit weight was 0.56 lbs and in November harvests, the average fruit weight was 0.49 lbs.
Relationship of Fruit Size and Number
One interesting thing to consider about these data is the
relationship between fruit number per plant and average
fruit size. Fruit size and fruit number in this trial were
significantly negatively related meaning that when fruit
size went up fruit number often went down
(r=-0.60, P=0.0049). Cultivars like Guyana will many smaller fruit
and Pink Brandymaster with fewer larger fruit illustrate this trend.
However, this was not true for all cultivars. For instance, Foronti had the second highest average fruit weight
while averaging the 3rd highest fruit number per plant.
Plant Production
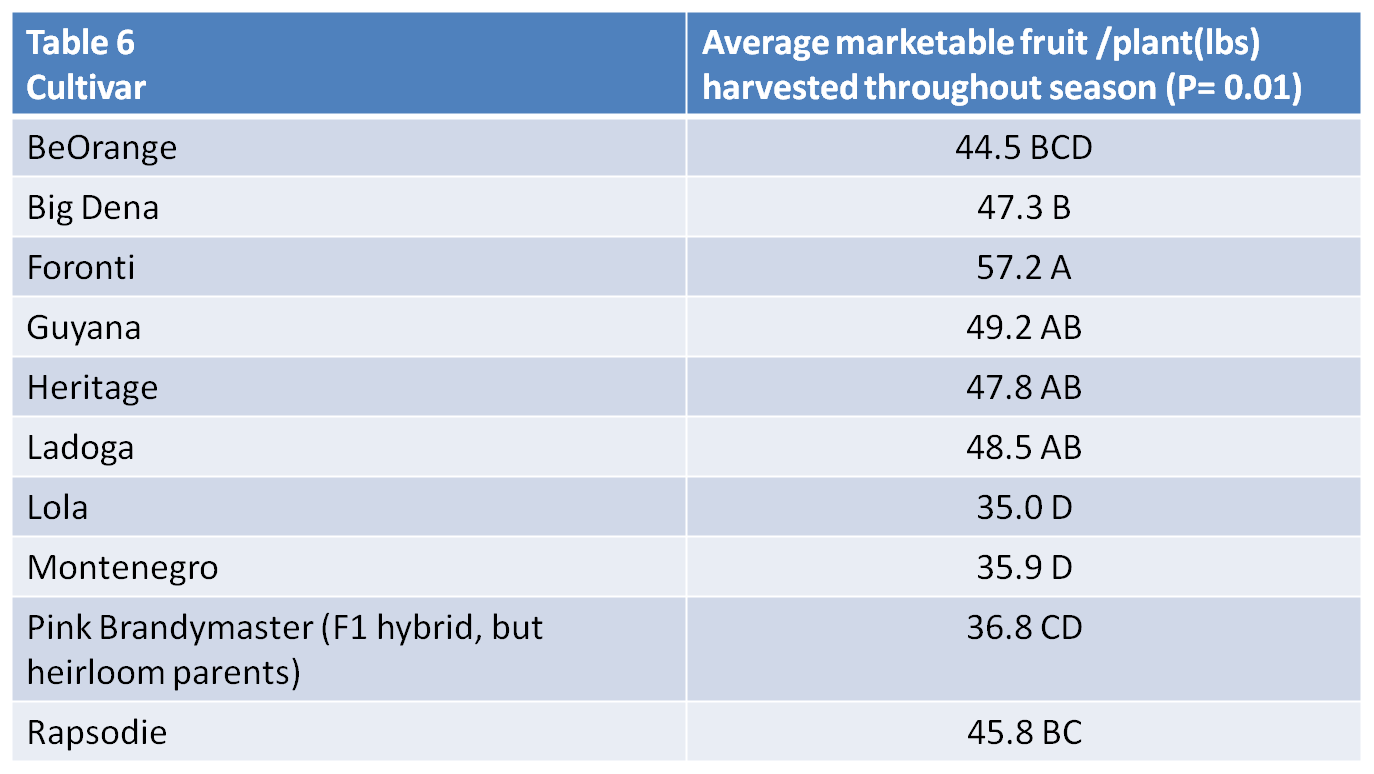
Data was collected to as accurately as possible describe the yield potential of the plant under conditions
tested. Marketable fruit included in these totals included first quality and slightly blemished fruit of all sizes
that were saleable. All fruit with damage due to blossom end rot, botrytis, etc. were not included in
production totals.
A few closing thoughts
This overview has thrown quite a bit of data at you the reader, but hopefully some of it has been useful. I
would like to close with a few comments and certainly feel free to email me with any further questions.
• Due to management and environmental factors, these yield numbers are not appropriate for basing
production estimates in your operation.
• This trial was undertaken to introduce our team at CropKing to several of the beefsteak cultivars currently
available. We used this project to chose cultivars to trial further and to suggest to growers for their own
evaluation. So, these numbers are only from one crop and are not the end- rather, they
are the beginning. Look for data in upcoming years from some of these cultivars.
hydroponics tomatoes hydroponics tomatoes